Stress Test
This page will show you how to stress test our data pipeline
1. NATS built-in testing
NATS provide some commands to test/benchmark the data pipeline (**nats bench**).
💡 Notes:
To use it, you have to install the nats_cli first.
Like all other
natscommand, you need to put any authentication you have. For example, if you are using TOKEN as your authentication, your command will look likenats -s nats://TOKEN@HOST [commands]Commands:Without Jetstream
nats bench [NAME_OF_TEST] --pub [N] --sub [M] --size [S] --msgs [X]- N: number of publisher
- M: number of subscriber
- S: size of each message
- X: number of total messages
With Jetstream
nats bench --js [NAME_OF_TEST] ...
The result will look like the attached screenshot. You can see how many messages per second for each publisher (mean & standard deviation).
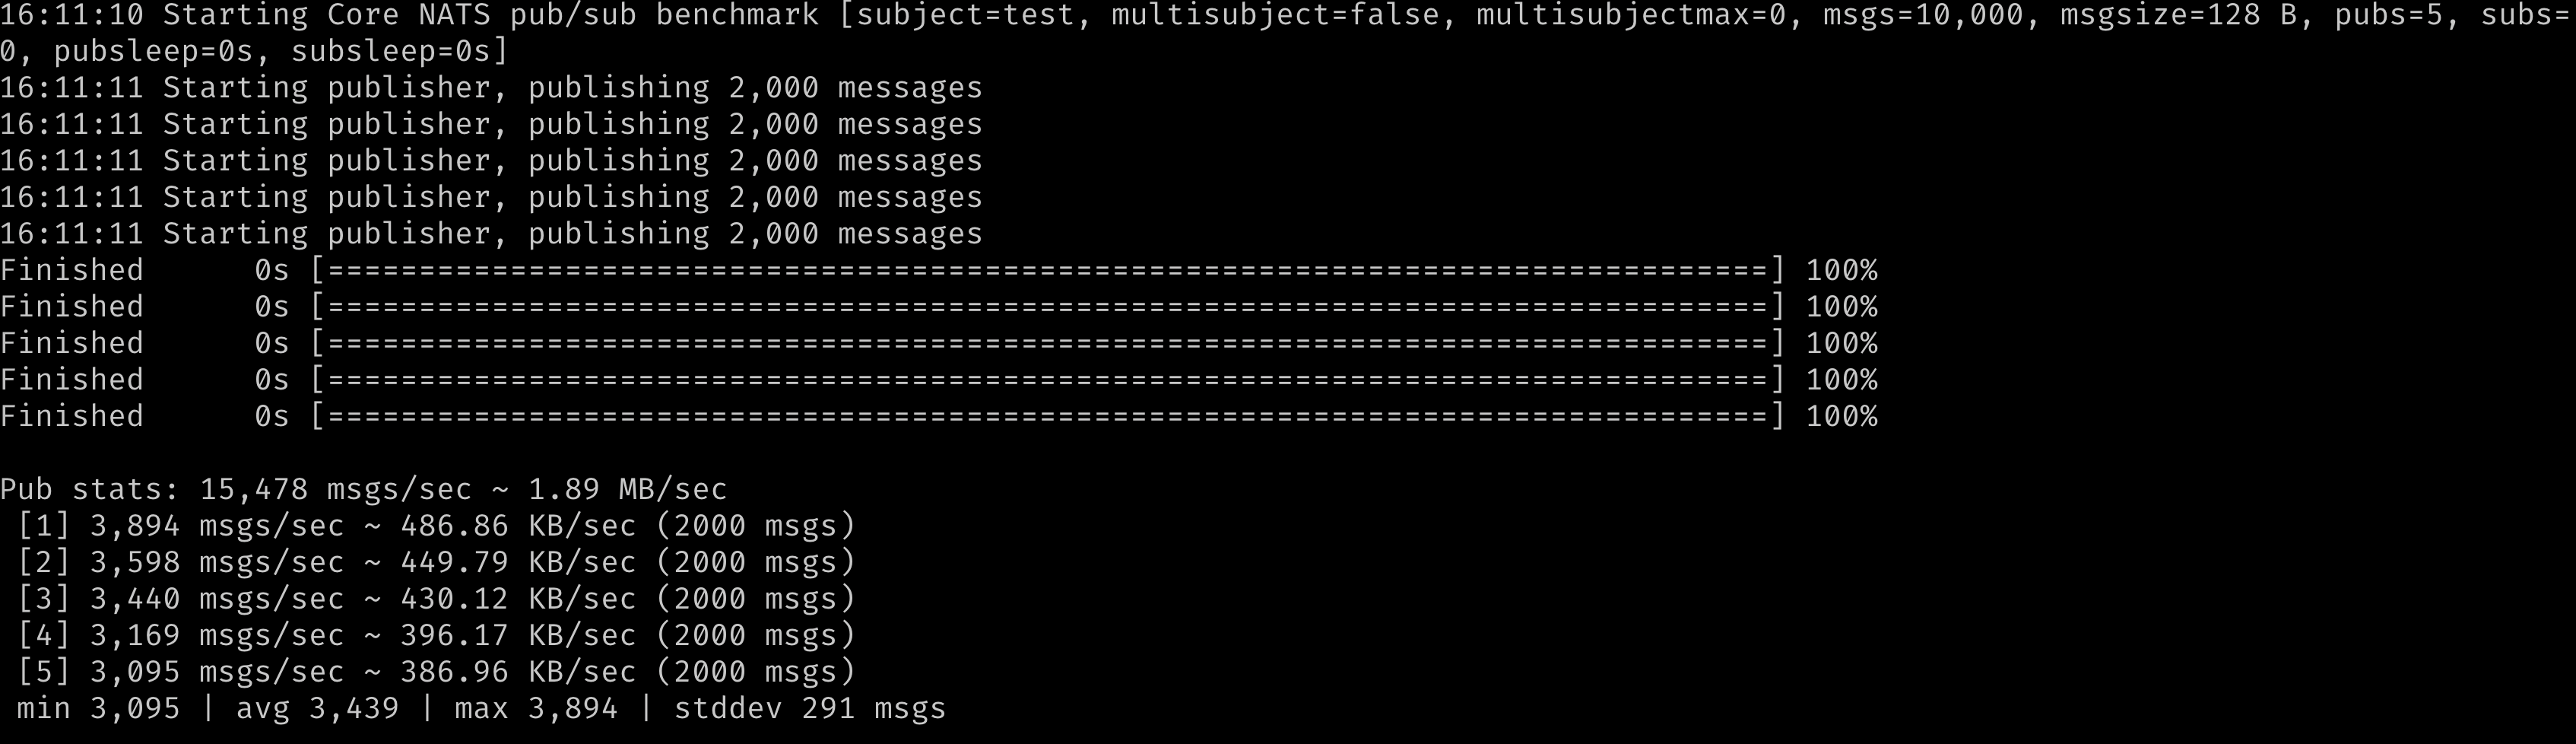
More details about it can be found here.
2. Write your own stress testing program
If you want more metrics or test the functionality of the whole pipeline, you probably need to write your own testing program. You can refer to this file change in our PR for more infomation!
2.1 Setup
The stress testing program works similar to a client, except it will use mock data instead of real-world data from dump1090.
- We use a shared queue to generate mock data at a fixed speed (10 messages/second to 1000 messages/second)
- Next, we have a consumer to pop data from the queue. The consumer will then publish data to the data pipeline. You can define how your messages will be look like now.
- You need some mechanism to collect metrics. You can find some examples (latency & throughput) from section 2.2 and 2.3.
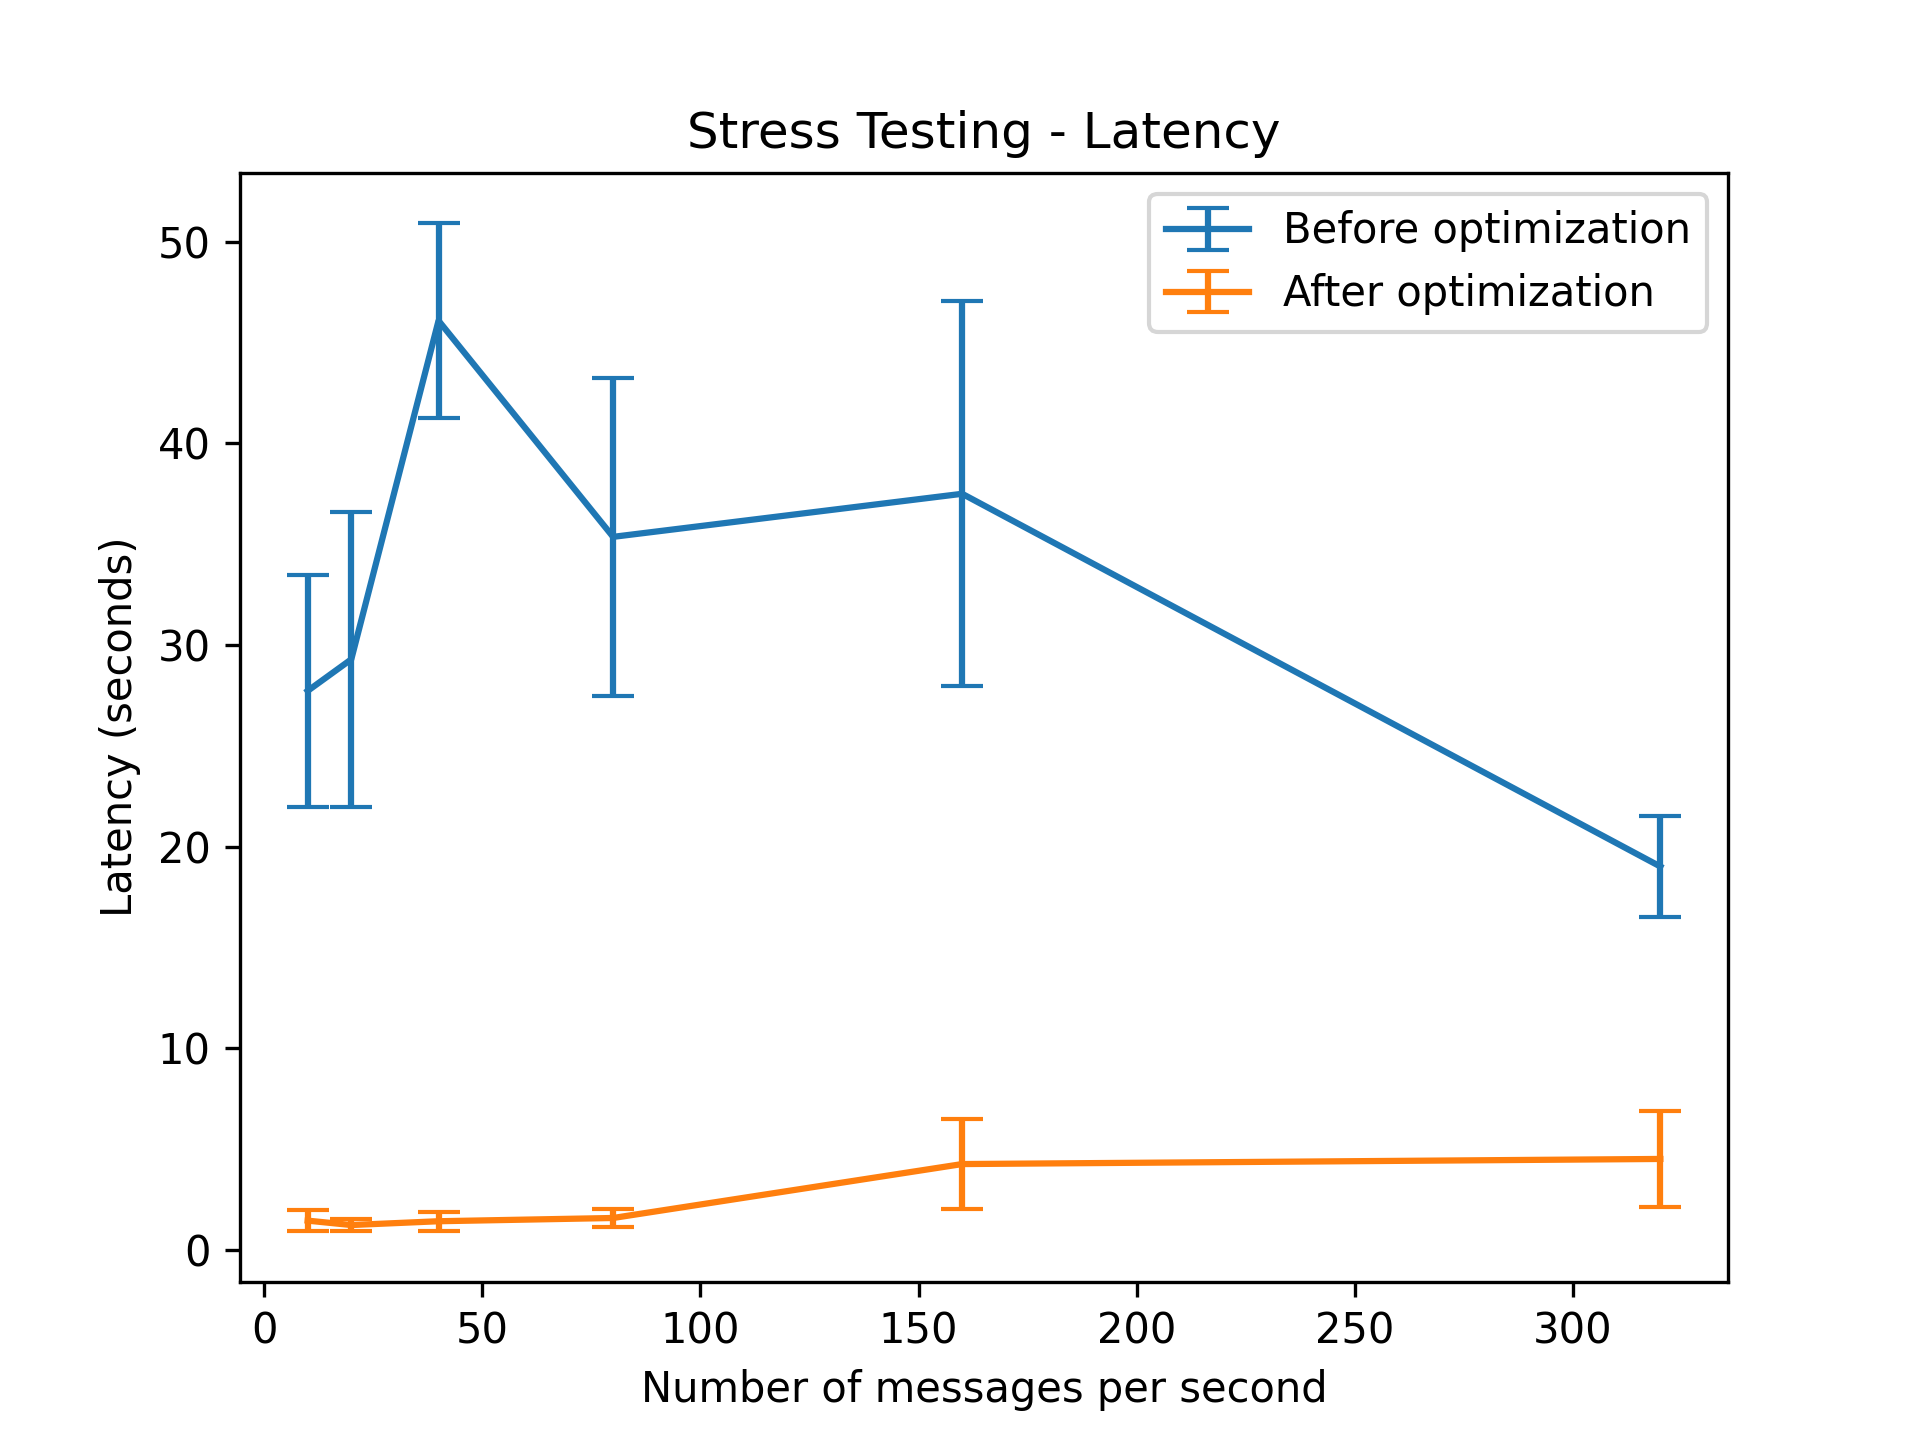
2.2 Latency
In order to test latency, we will collect both the time when a client sent it and the time when the Elastic Search see it.
- You need to put those two time field into your data.
- This can be done easily by using the
datetimemodule in Python for both client and elastic search.
- This can be done easily by using the
- After publishing messages with your stress test script, query the elastic search DB to collect all the data from stress testing.
- This can be done by using the
elasticsearchmodule in Python. You can refer to the Elastic Search Notes (link todo) for more information - You might need to wait for all the messages to be stored in the DB since there will be delay when message/second is large
- This can be done by using the
- After collecting all the data, do the math whatever you want!
We used mean and standard deviation to show the result, the plot we get looks like this.
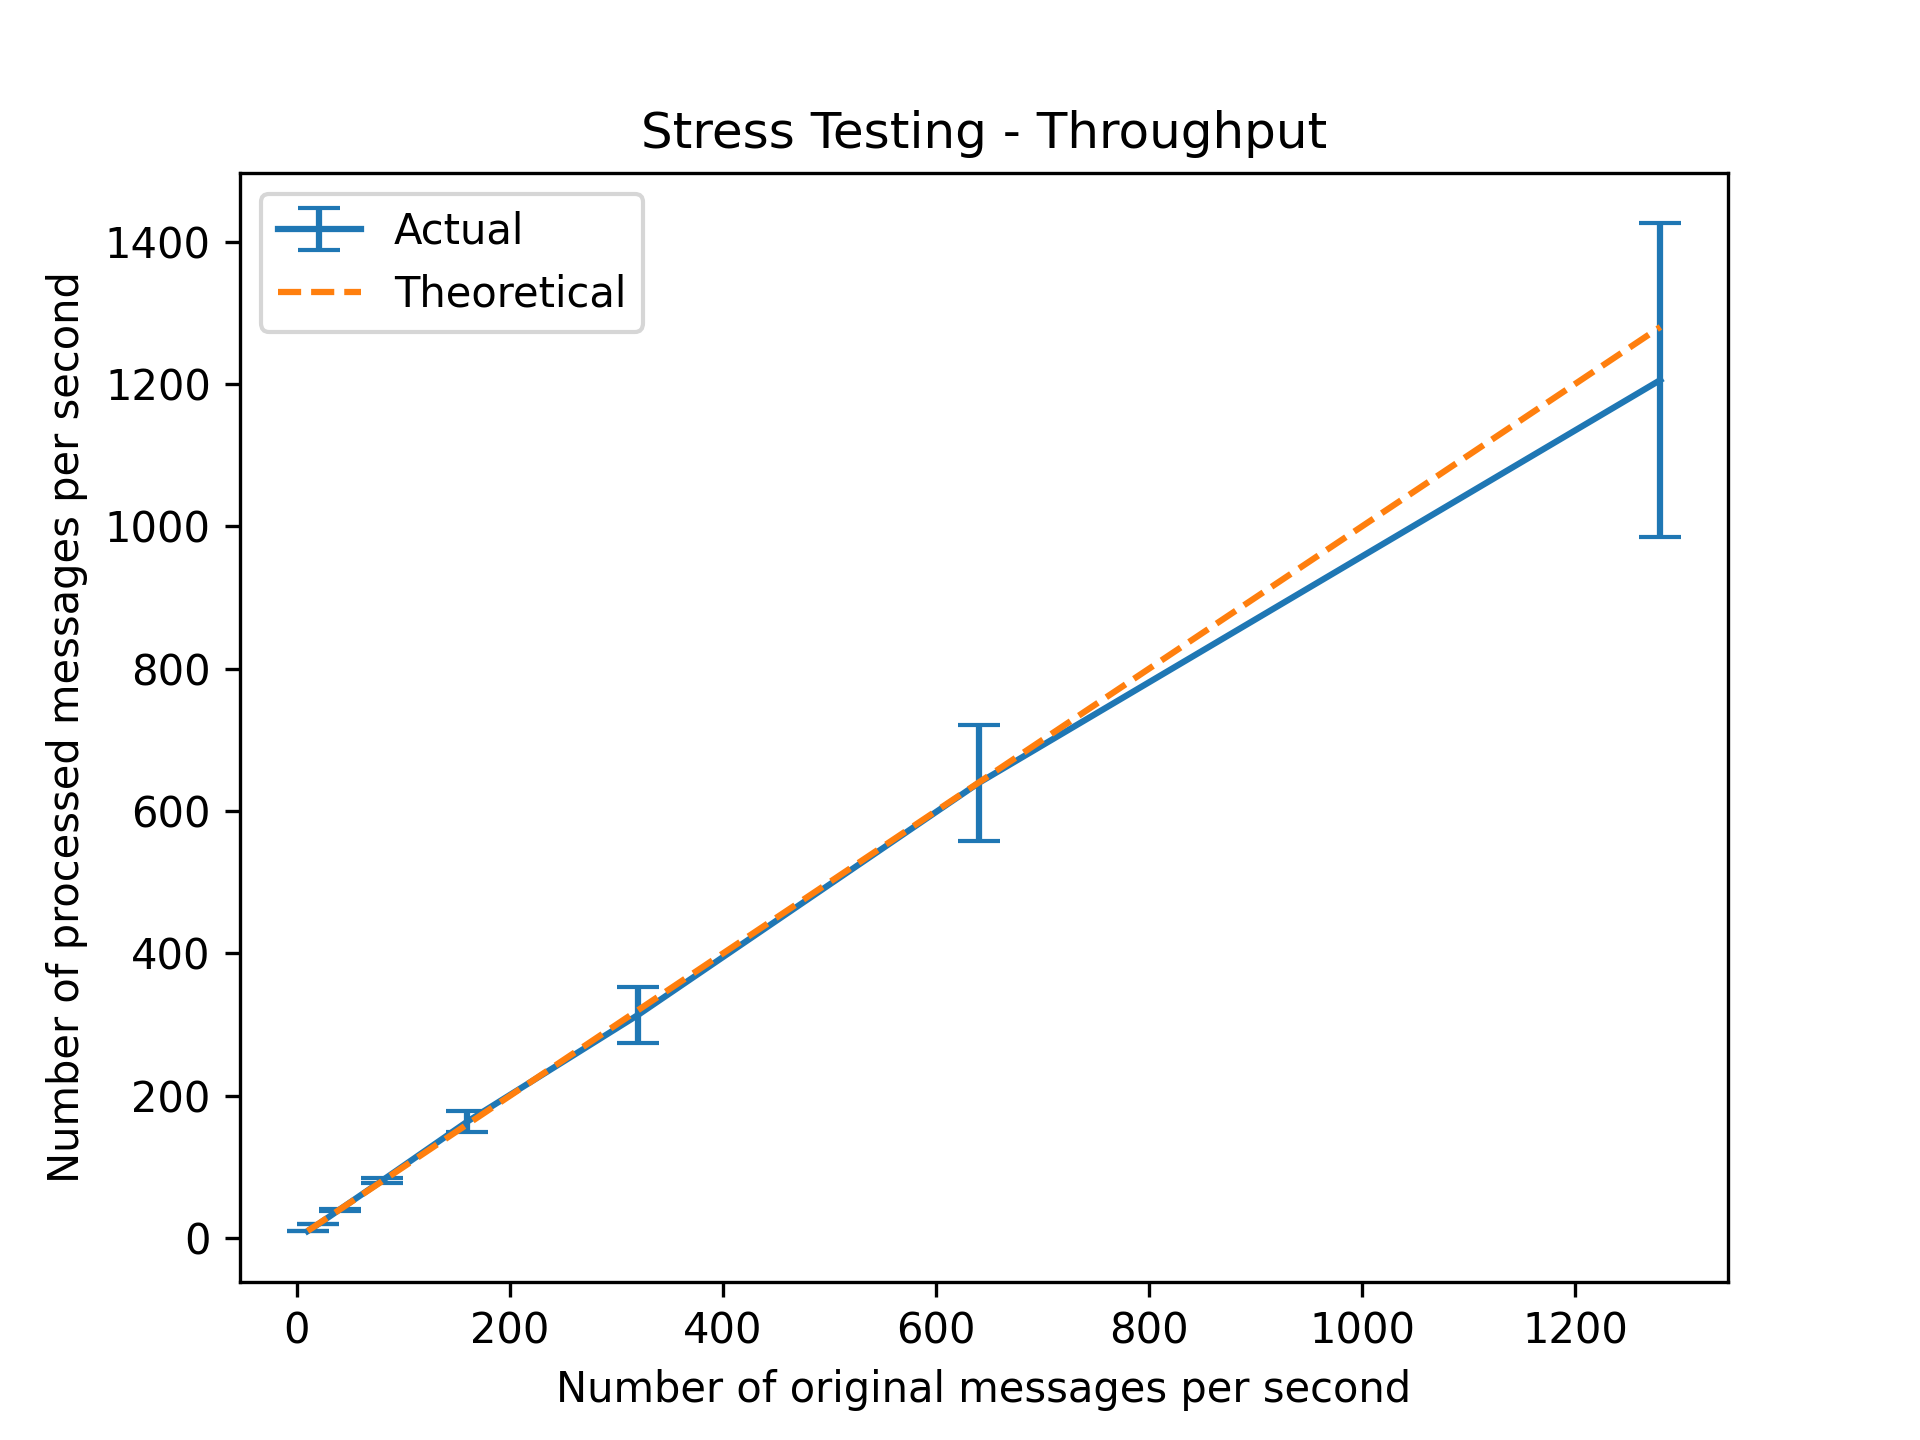
2.3 Throughput
In order to test throughput, it is similar to 2.2 latency and even simpler.
- After publishing messages with your stress test script, query the elastic search DB to collect all the data from stress testing.
- This can be done by using the
elasticsearchmodule in Python. You can refer to the Elastic Search Notes (link todo) for more information - You might need to set a waiting time (X) in your script so that you can # messages client sent vs # messages elastic search received after X seconds.
- This can be done by using the
- After collecting all the data, do the math whatever you want!
We used mean and standard deviation to show the result, the plot we get looks like this.