Storage & Search Engine
ElasticSearch (ES) is a distributed search and analytics engine that provides database-like functionality to store, search, and/or analyze real-time data. This is a core component in our pipeline that comes sequentially after the Annotator. It consumes all the annotated data from the pipeline and serves multiple purposes–including monitoring the Client status, storing the data, and finally serving as a persistent database to the backend flask server.
Install ElasticSearch
We now showing how to install standalone Elasticsearch on EC2 instances.
For large-scale production use case, it is better to install distributed cluster. We don’t cover that settings for now.
Before installing the ES, we should make sure that the system satisfies the requirements.
- The EC2 instance has at least 8GiB of memory, and allocate more than 4G to ES container
- Modify the
vm_map_countaccording to:
Then install the ES according to the:
Install Elasticsearch with Docker | Elasticsearch Guide [8.6] | Elastic
After installation, make sure we get the elasticsearch user password, certificate(http_ca.crt), and enrollment token.
If not, we can log into the container and use tools below to get the credentials again:
/bin/elasticsearch-create-enrollment-token : generate new enrollment token
/bin/elasticsearch-reset-password: reset the password
Configure ElasticSearch Cluster
Elasticsearch can be configured by setting elasticsearch.yml, which has been mounted from host machine to the container. In practice, not changing any default config is enough for tutorial use, but when it comes to production, there are multiple settings that need to be considered carefully.
Configuring Elasticsearch | Elasticsearch Guide [8.6] | Elastic
We can also use API to configure a running Elasticsearch instance
Cluster update settings API | Elasticsearch Guide [8.6] | Elastic
Install Kibana
Kibana is the visualization tool for Elasticsearch.
Also, we install Kibana with Docker container.
Install Kibana with Docker | Kibana Guide [8.6] | Elastic
Start from Run Kibana on Docker for development session, step 3. After installation, we use the previous user credentials and enrollment token to use the kibana.
Configure Index
The index is an ES-specific name, just like a table in a Relational database or a collection in a SQL database.
Before sending data to the Elasticsearch cluster, we may want to configure the upcoming index property. (i.e. the index created by the new data), in minimum settings, we care about two things.
- Data searchability
- Data Retention
First we create a index lifecycle policy:
Kibana → Stack Management → Index Lifecycle Policies
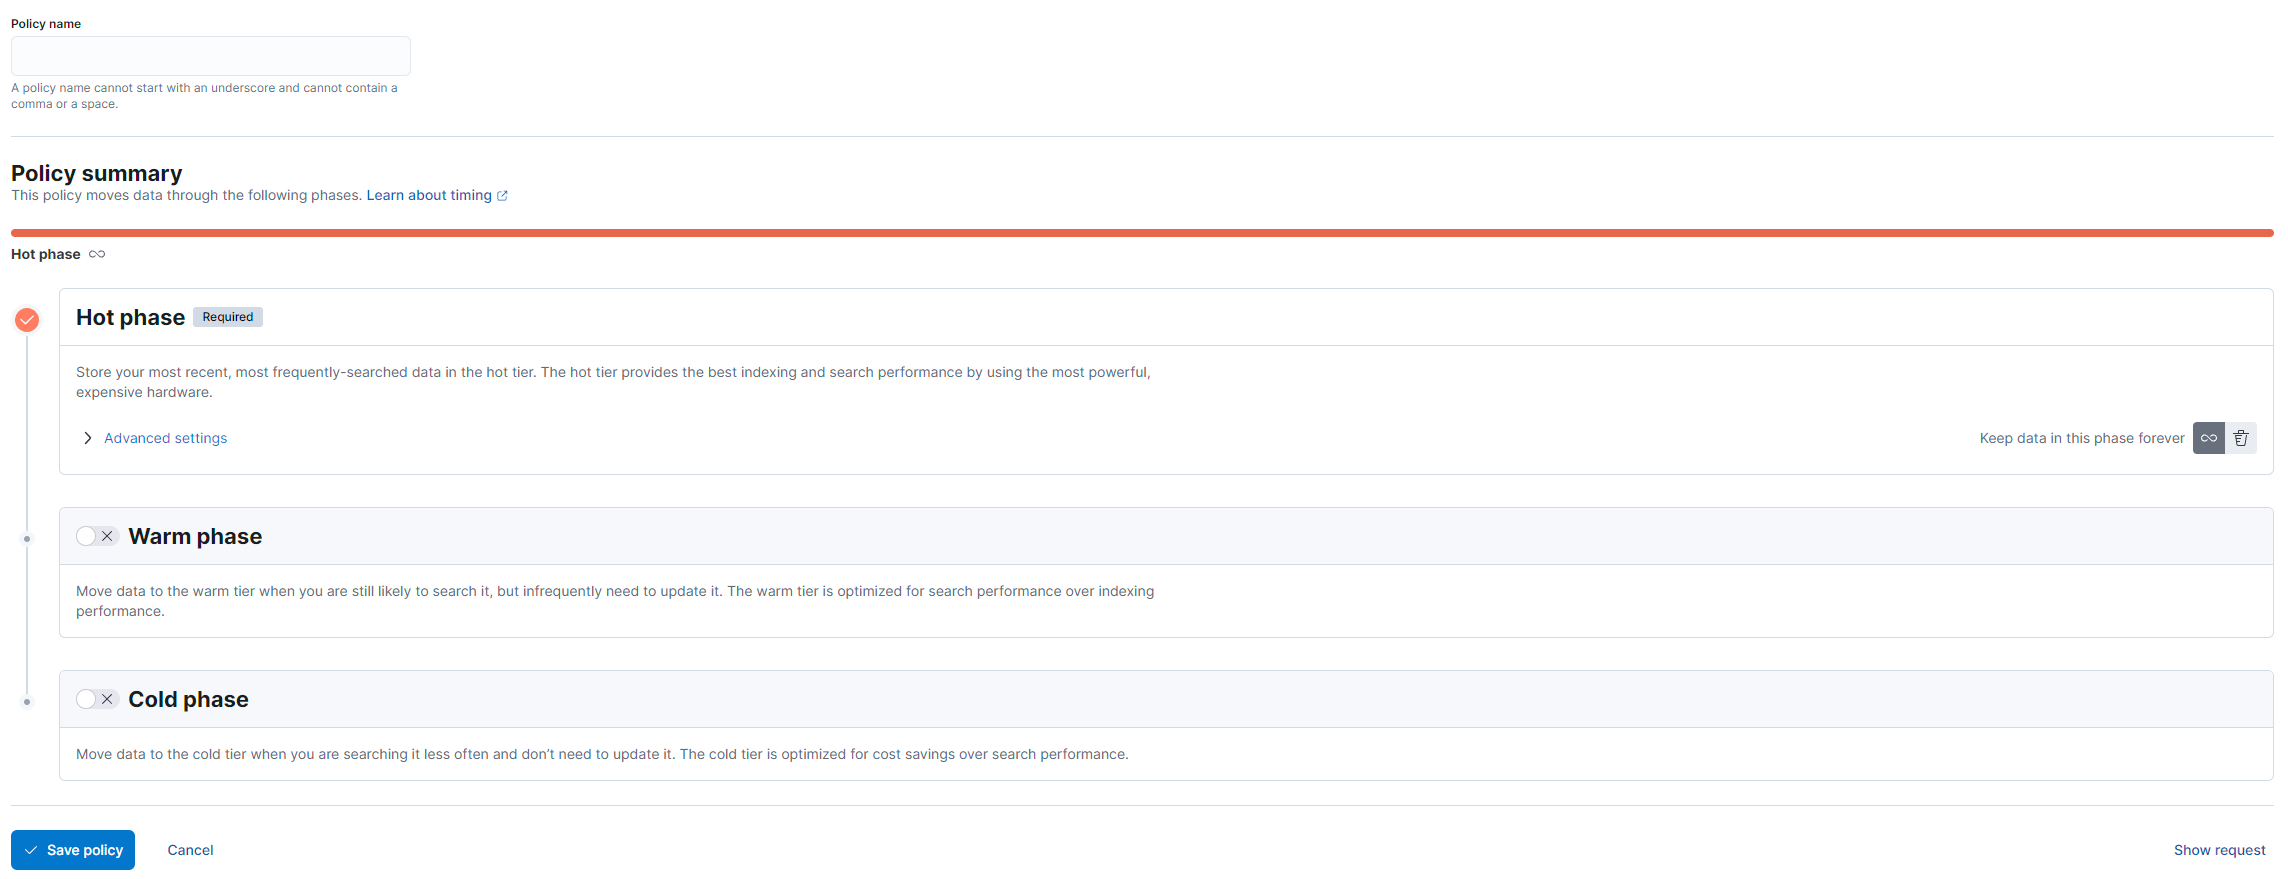
Set the retention policy as we like, name it default-retention-policy then go to
Kibana → Stack Management → Index Management → Index Templates
We create an index template, choose a name, set index patterns to be 2023-*-* ,client status
Later on if create any index that matches the pattern, the ES will provision the index according to our index template.
On index settings page, paste the json
{
  "index": {
    "lifecycle": {
      "name": "default-retention-policy"
    },
    "max_result_window": "2000000"
  }
}
On Mappings page, paste the json
{
  "properties": {
    "time": {
      "type": "date"
    }
  }
}
Other settings remain default or blank, finish creation.
Send data to Elasticsearch
After installation and configuration of all the components, we can set up the client and start sending data to Elasticsearch.
In practice, we use Python Elasticsearch Client to manage the connection with ES.
The example can be found at ./elastic/elasticsearch/elastic-client.py
Also the backend is built on ES Client, in ./elastic/backend/server.py
Data analysis - Future Work Ideas
Elasticsearch provides many useful tools for analyzing the data on the host and enables us to build ML applications from our pipeline.
For ML application:
Use Cases:
- AI Ops and Threat Hunting
- Prediction
- Search unstructured data
Potential ML applications:
- Anomaly Detection
- Deploy an ML model to detect anomaly events in the incoming data
- The model automatically learns patterns from the incoming data
- We can create a dashboard that shows anomaly scores in specific time intervals
- Useful in filtering out the data, especially detecting the bot traffic that might mess up the pipeline
- Easy to apply and help make the pipeline robust with automation
- ML application specifically for airplane locations
- Based on airplane markers, predict which stage of the airplane is currently in
- Just take off
- Arriving
- Still flying
- …
- Based on airplane markers, predict which stage of the airplane is currently in
Notes
- Anomaly Detection: Health maintenance for the whole data pipeline
- Support different spectrum application
- Not super priority
- Testing
- Specific to airplane data