Dashboards
1. Check Out Our Dashboard for the Airplane Tracker Example
⭐️ Grafana Endpoint (Dashboards): http://a524500a80d314a64953fb349920eceb-1736286925.us-west-2.elb.amazonaws.com
- The Prometheus Endpoint which lets you query the data ⭐️ Prometheus Endpoint: http://a1e737e99fe0c48bd8f88445fe7650f0-1254458216.us-west-2.elb.amazonaws.com/
2. Overview
Prometheus is a monitoring system and time-based database. We use Prometheus to monitor and gather our system’s status, storing it in its database. The data will then be exported to Grafana for graphical analysis. The goal of using Prometheus and Grafana is to create a dashboard for system administrators to check the system status.
3. Build the Dashboard
1) Install Prometheus and Grafana Helm chart
We use the Prometheus Helm chart to install the app into the Kubernetes cluster.
- Install the Prometheus Helm chart, using the
values.yamlfrom adsb-nats/dashboard at master · ml4wireless/adsb-nats (github.com) (download thevalues.yamland usinghelm install -f values.yamlwhen installing the helm chart)
prometheus 19.7.2 · prometheus/prometheus-community
- Install the Grafana Helm chart , using the
values.yamlfrom adsb-nats/grafana.yaml at master · ml4wireless/adsb-nats (github.com).
grafana 6.52.3 · grafana/grafana
- Get the Grafana password
kubectl get secret — namespace default grafana -o jsonpath=”{.data.admin-password}” | base64 — decode ; echo] (you can save it for future use)- The username is default to
admin
- The username is default to
- Get the Grafana service IP by
kubectl get svc -Aand see the external IP field of Grafana service. It’s worth notice that in step 2, ourvalues.yamlindicates to the helm chart to expose Grafana service asLoadbalancertype, so that the cloud provider will automatically provision an external load balancer here as the entrance of service.
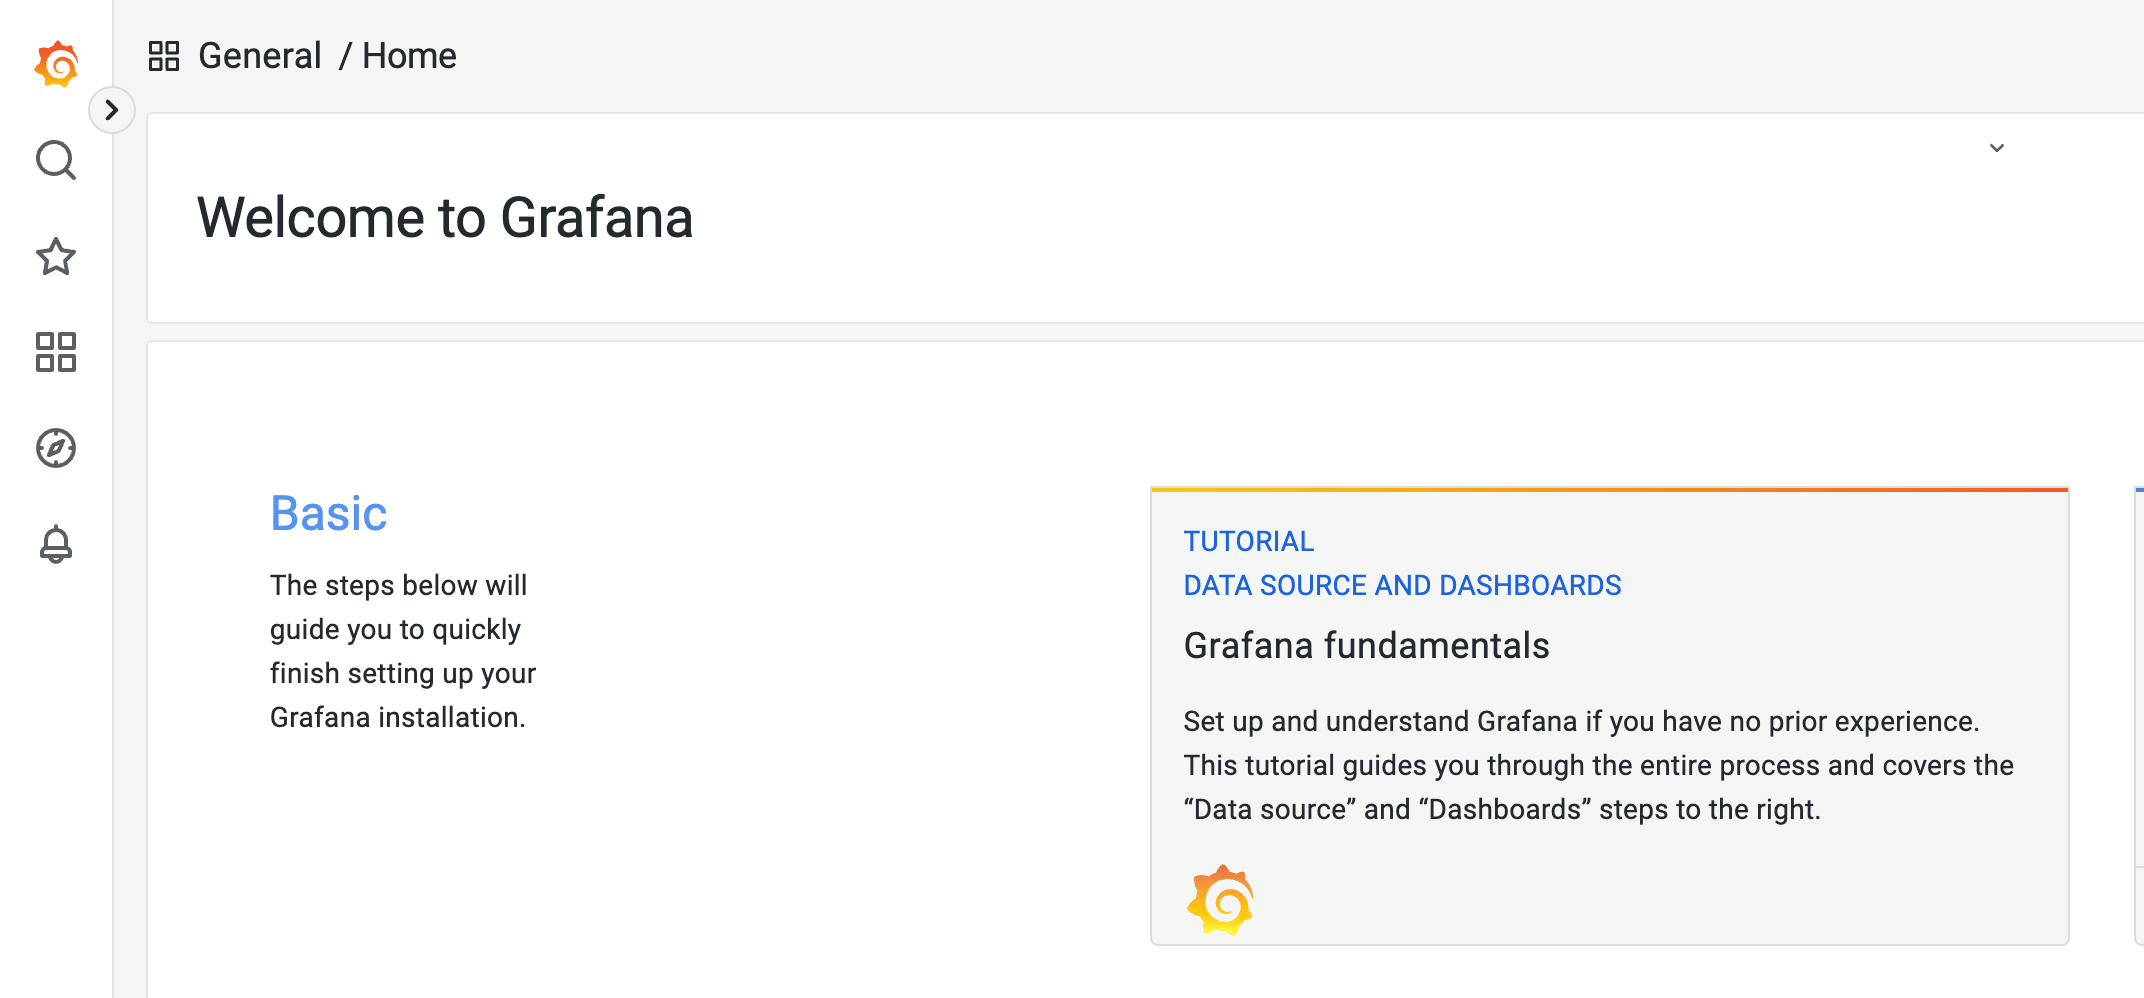
After all these steps, you should be able to view a grafana-style frontend page from the service IP using the username and password from step 3).
2) Start Prometheus & Grafana
Prometheus
Prometheus will use the configuration file located in this directory.
prometheusGrafana
Start your Grafana server. Your settings may differ. Try starting with the server config included in the Grafana tarball.
grafana-server --config=/usr/local/etc/grafana/grafana.ini --homepath /usr/local/share/grafana cfg:default.paths.logs=/usr/local/var/log/grafana cfg:default.paths.data=/usr/local/var/lib/grafana cfg:default.paths.plugins=/usr/local/var/lib/grafana/plugins
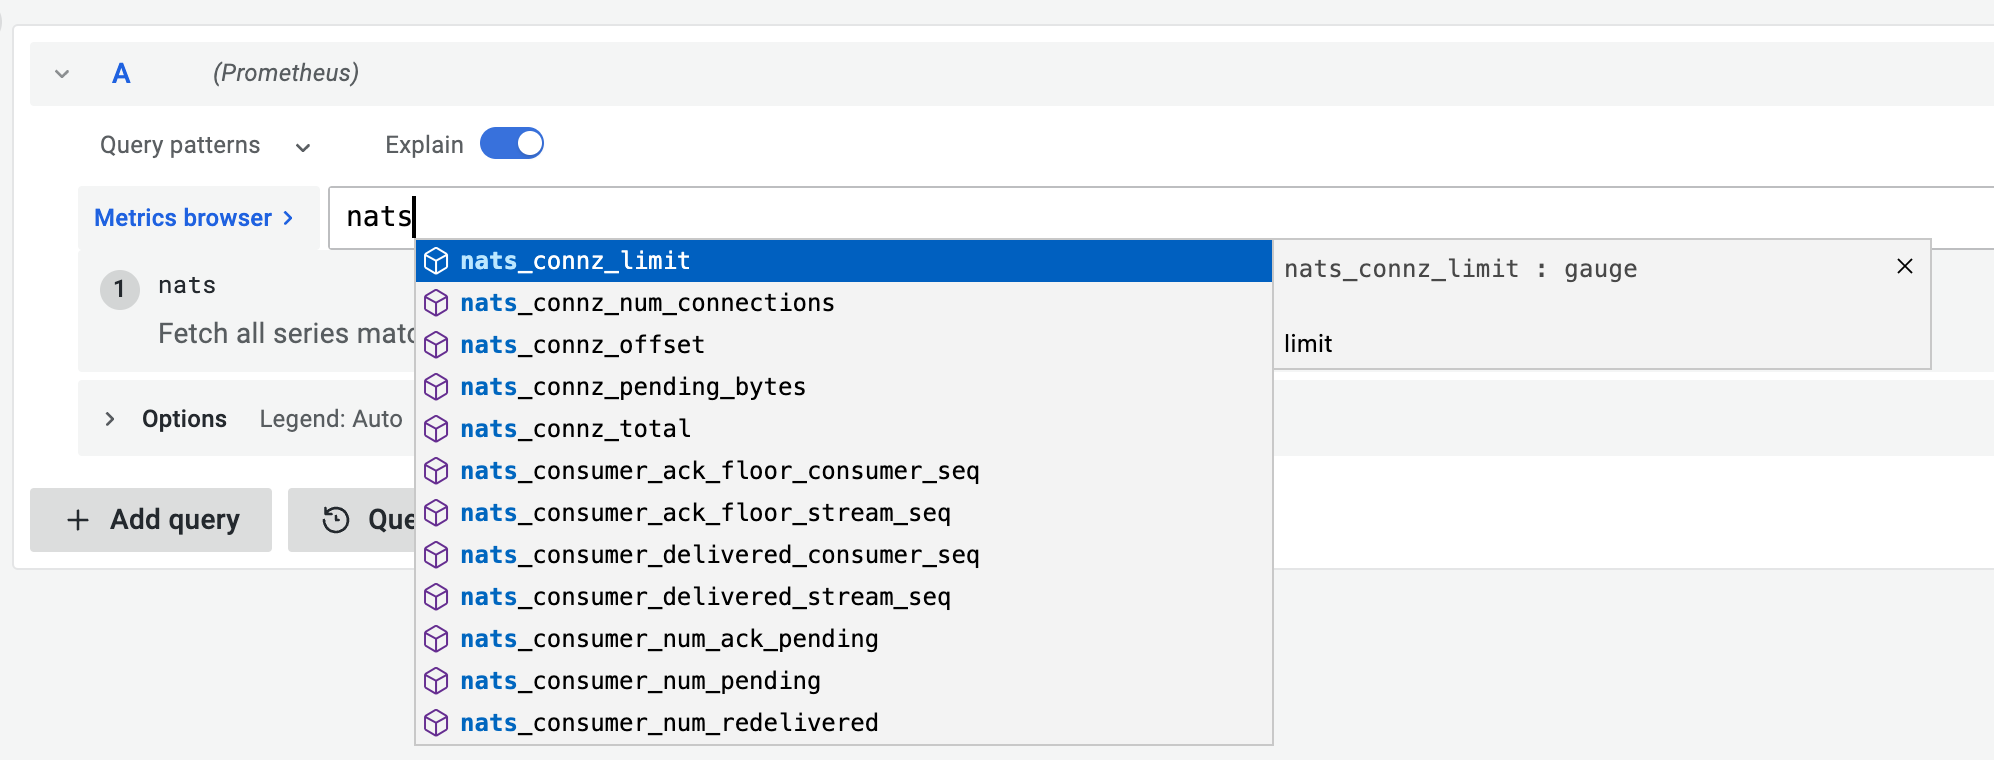
3) Adding NATS exporter
A NATS exporter is a service that scrapes the metrics from NATS, exposing these metrics to an endpoint, and then Prometheus will gather those metrics to the backend from that endpoint.
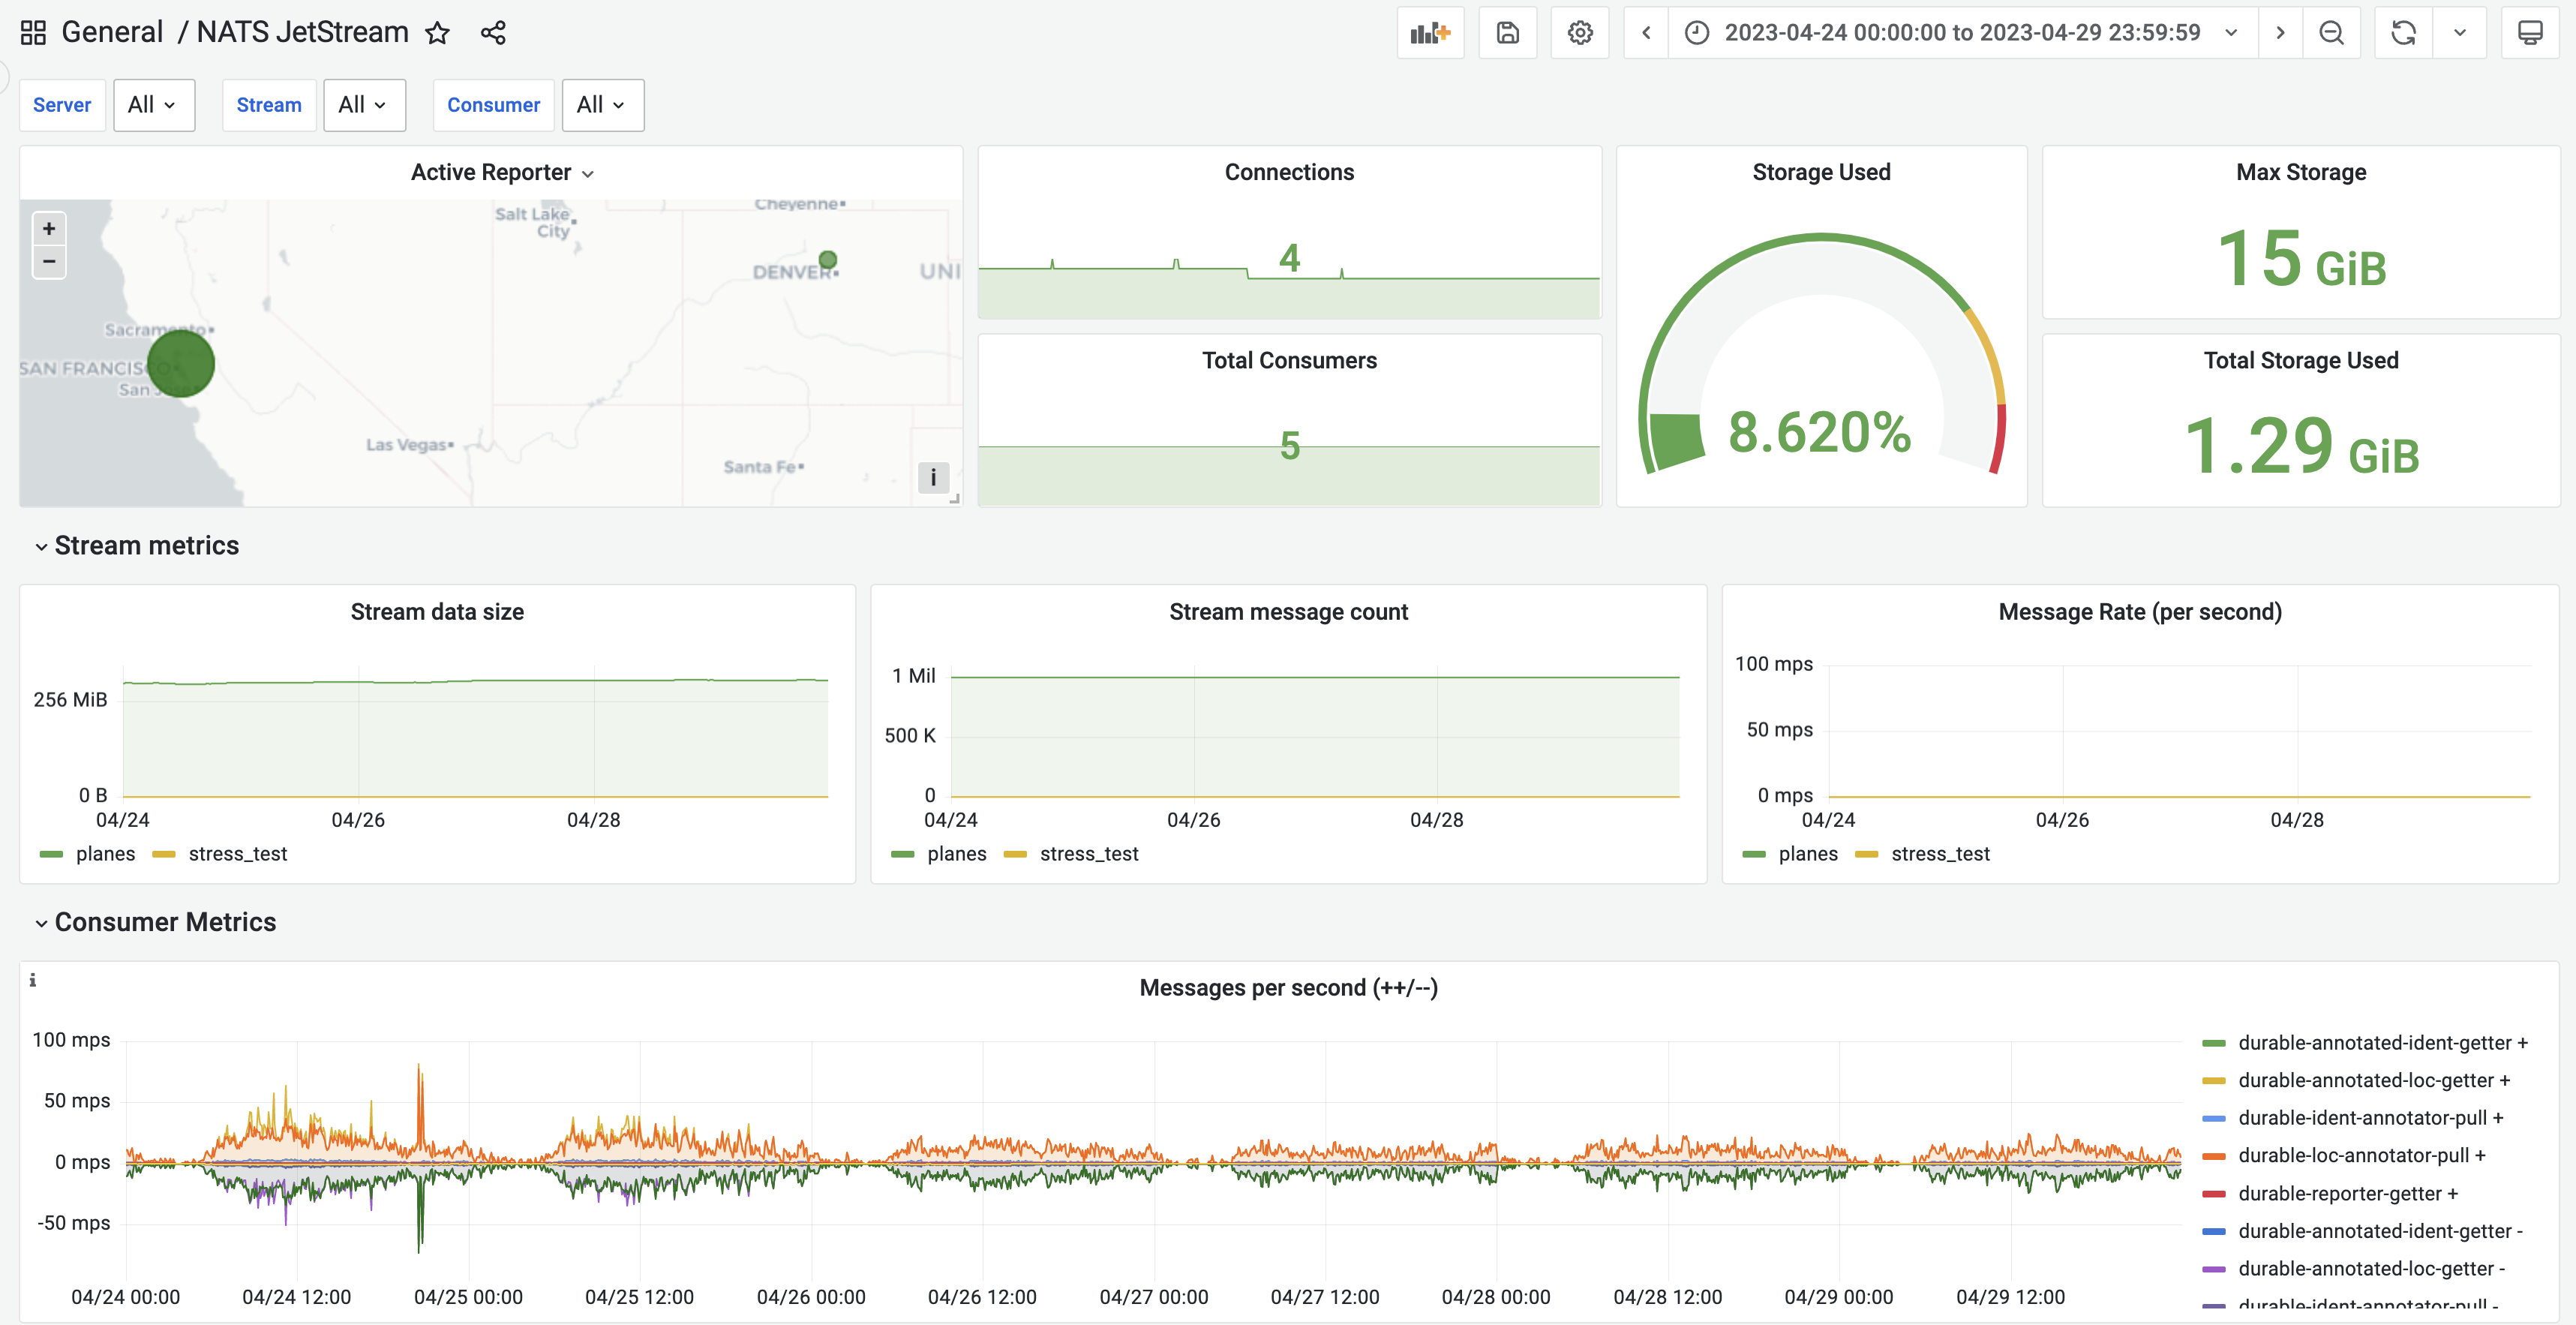
After adding the NATS exporter, you should be able to see NATS related metrics in the Grafana frontend like the screenshot below.
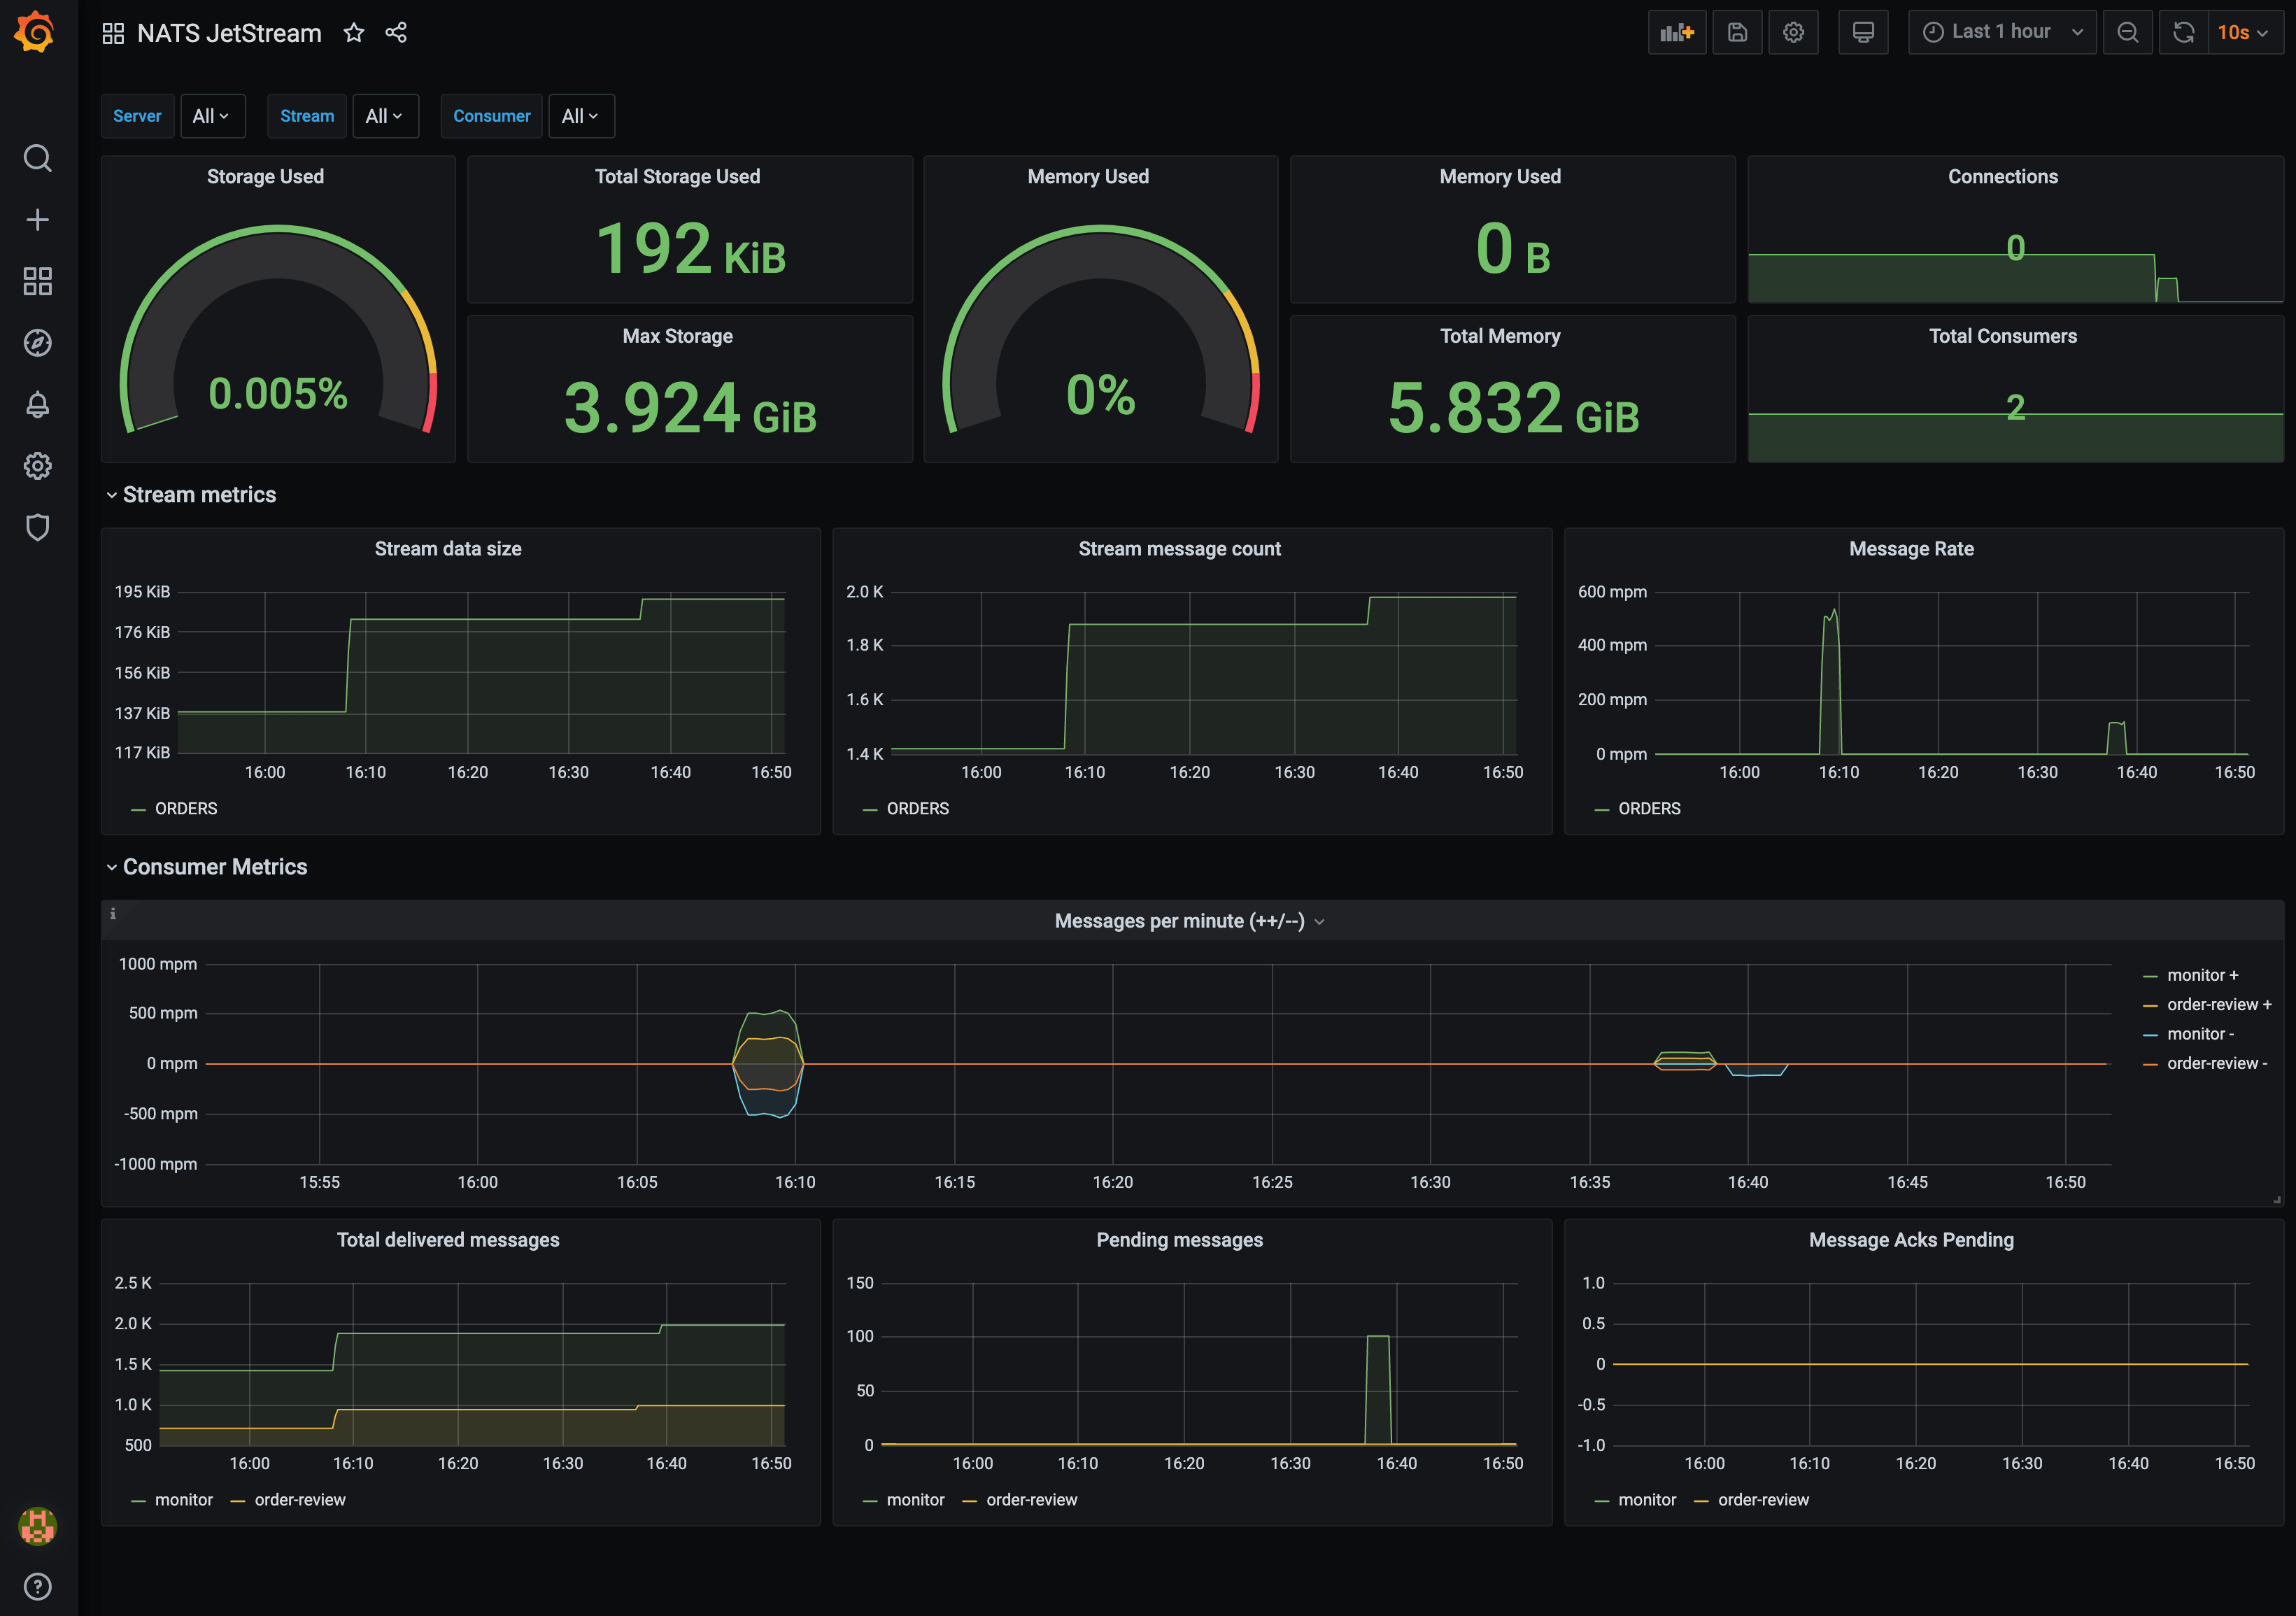
4) Adding Grafana Dashboard Template
The next step is to adding different dashboard template to your Grafana frontend so that you can view different system metrics in a user-friendly GUI.
- For NATS, there exists a pretty decent template that we can directly use. Jetstream Dash Helm is one of templates that we used in our application.
The following page also provides a great walkthrough.
prometheus-nats-exporter/walkthrough at main · nats-io/prometheus-nats-exporter
5) Adding other sources of data
In addition to the existing template and data sources, we can also add different sources of data to our system health dashboard. For example, in our airplane application, we used some data from our elastic search to visual the location of each reporter.
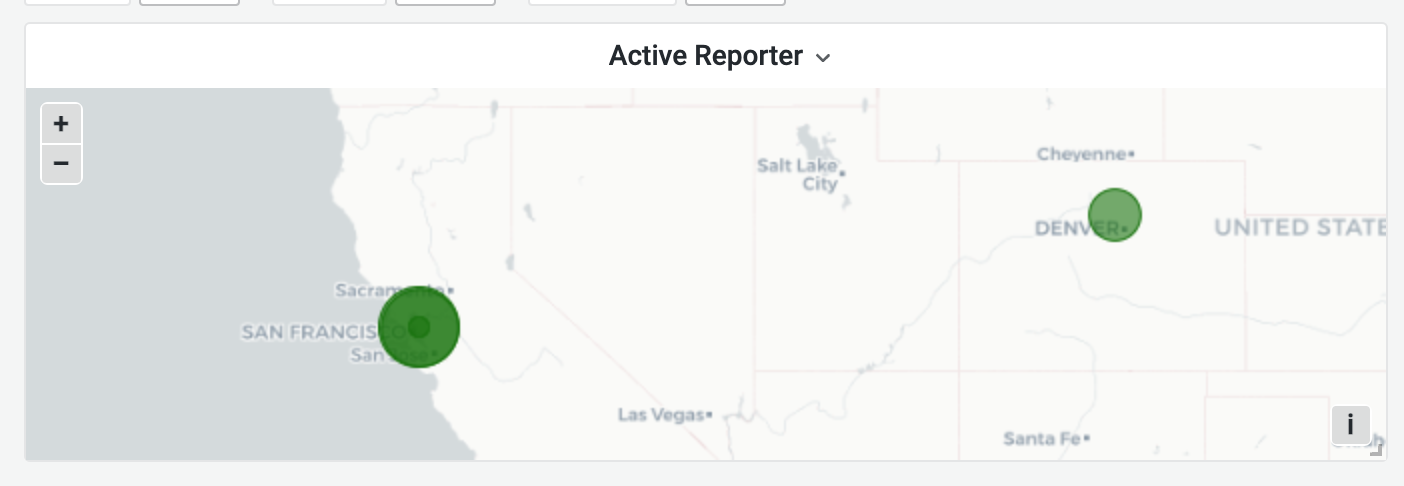
In order to build something like this, you need to:
Add data sources to grafana
You can add it by using its frontend GUI and insert any authentication you have for your elastic search
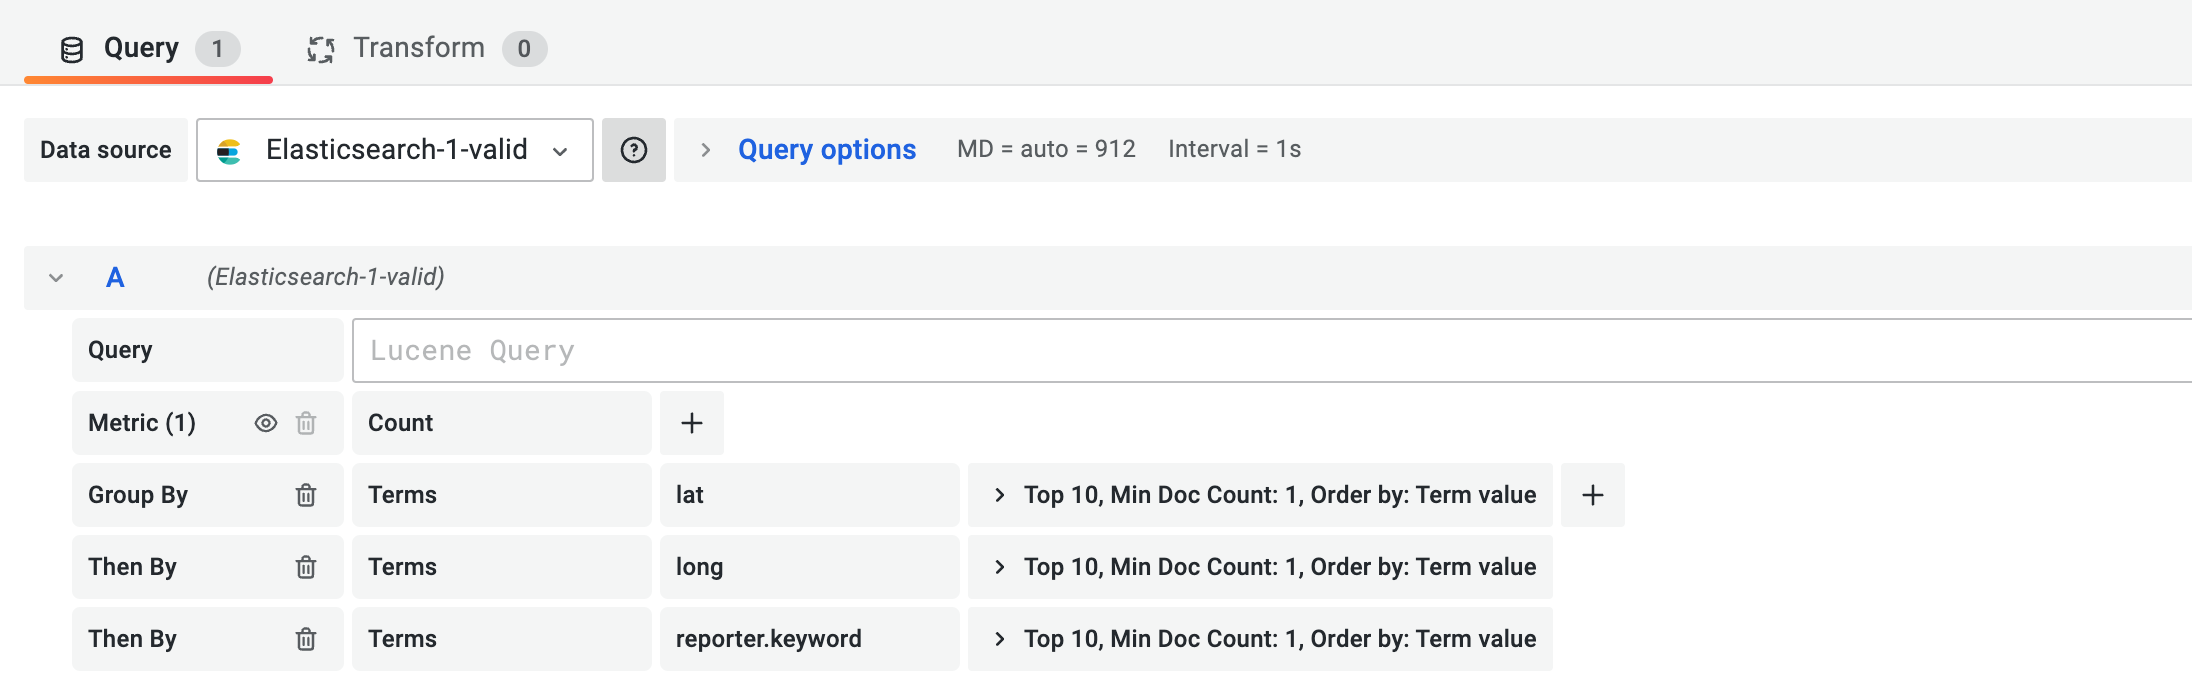
Verify and write your own queries
Here is an example of Lucene Query we wrote. You might need to learn more about the language and write your own query.
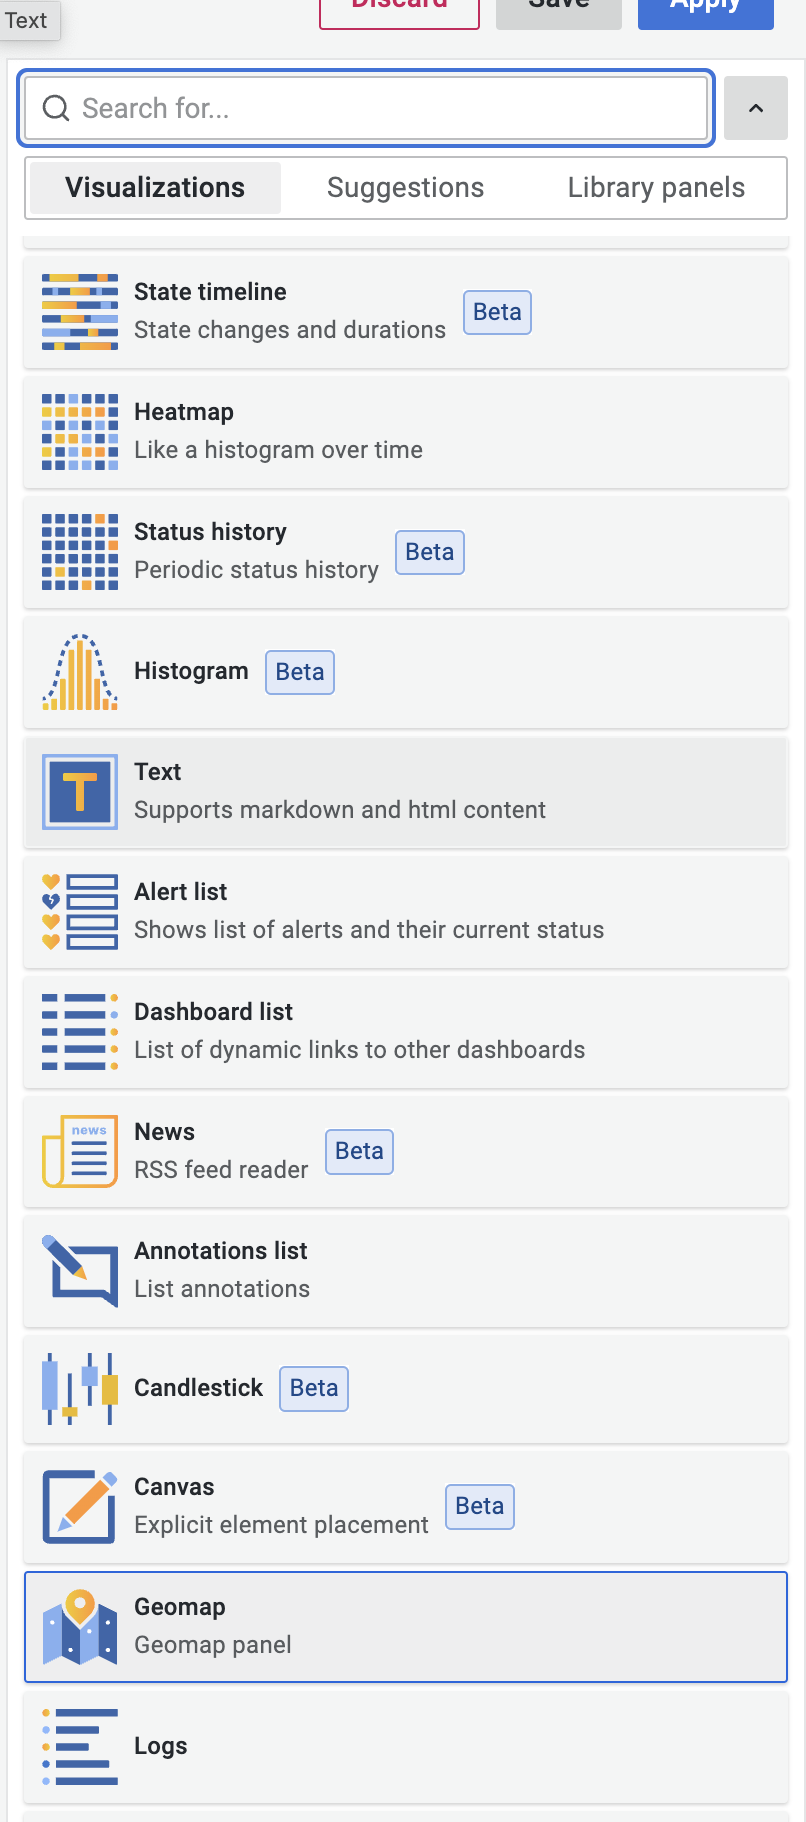
Adjust Grafana settings for GUI
We choose geomap for our visualization since we are focusing on the location data. It is also pretty common for spectrum related application. You can also change it using Grafana frontend and adjust corresponding settings (e.g. geo marker center, scale).
With these steps, you should be able to create any visualization for your application and even combine with any previous template to build a customized, pretty system health dashboard!